

Manager workflow
1:1 prep and recording
Load manager conversations with context and keep action items tied to follow-through.
Feature spotlight
Built for engineering managers and leaders who need to understand what a contributor is actually carrying before stepping into a coaching, calibration, or retention conversation.
Primary job
People context
the contributor view turns team-level movement into individual manager action
Best cadence
Weekly
most useful when checked alongside 1:1 prep and the weekly review
Decision type
Manager action
coaching, support, growth, and retention conversations
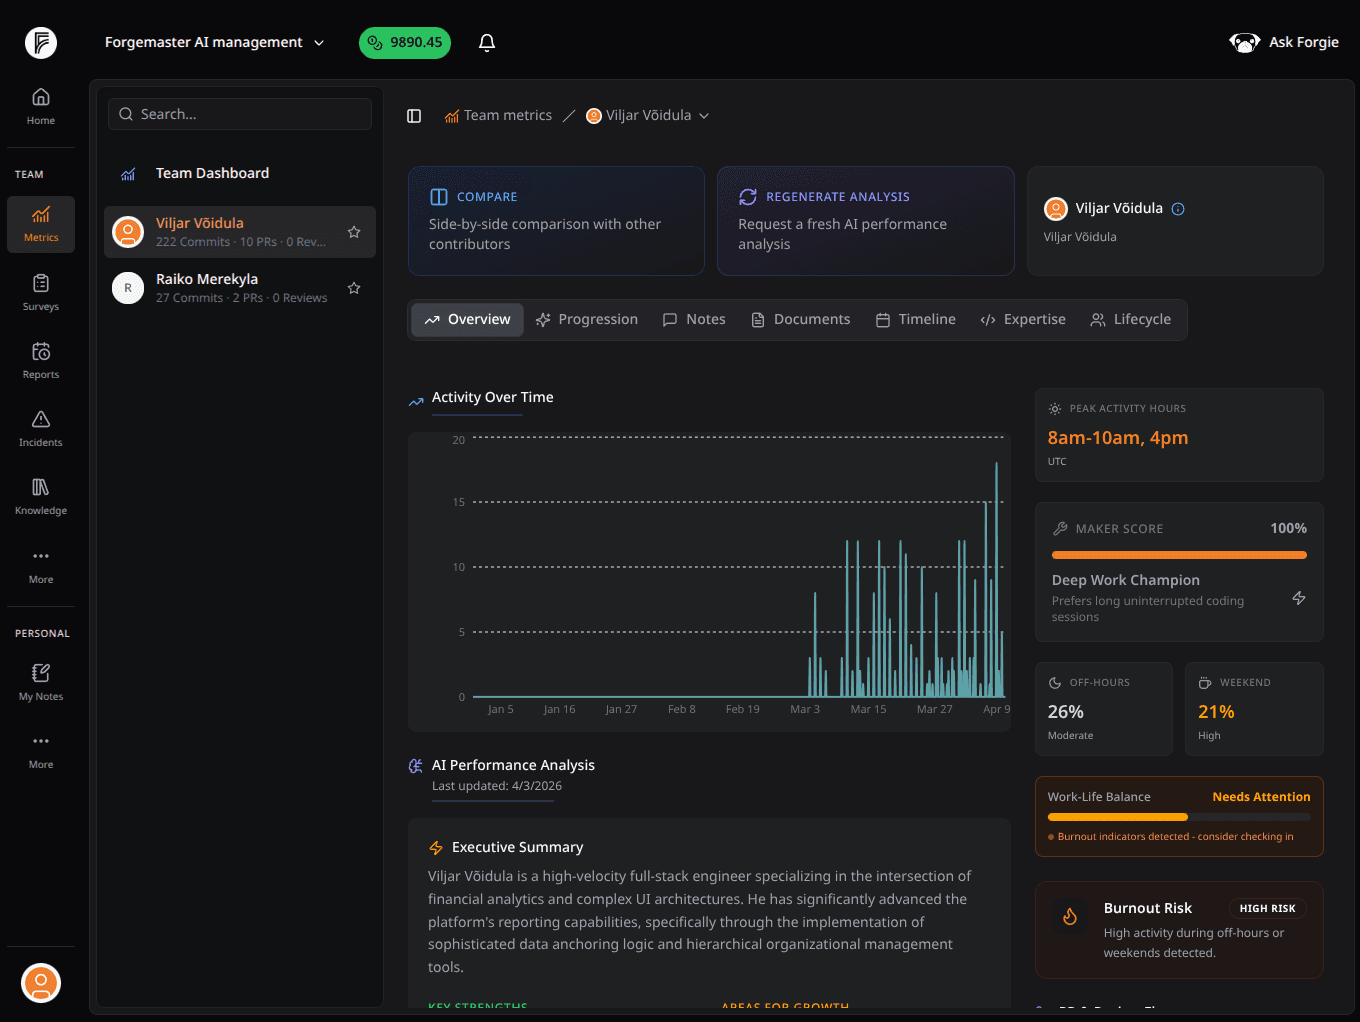

Who it's built for
Engineering managers
Use contributor profiles to prepare better 1:1s, spot strain before it becomes a resignation, and connect daily signal to longer-term growth conversations.
Founders and CTOs
See which contributors carry critical system risk, identify compensation misalignment, and understand who the engineering org genuinely depends on.
Investors and due-diligence stakeholders
Read key-person risk, contribution concentration, and team depth without asking the company to self-report it.
Contribution rhythm
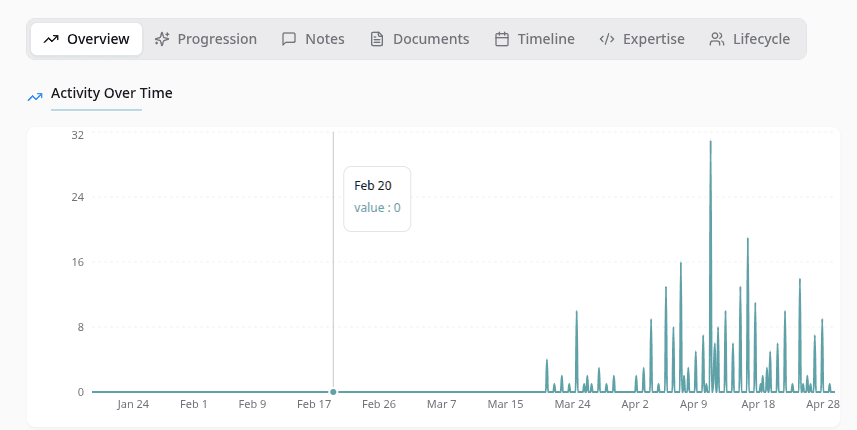
The activity chart shows daily contribution volume over months — not just recent sprints. That context is what turns a 1:1 from a gut-feel discussion into an evidence-backed one.
Most burnout signals start weeks before a manager notices. The timeline is where they first appear.
Delivery context
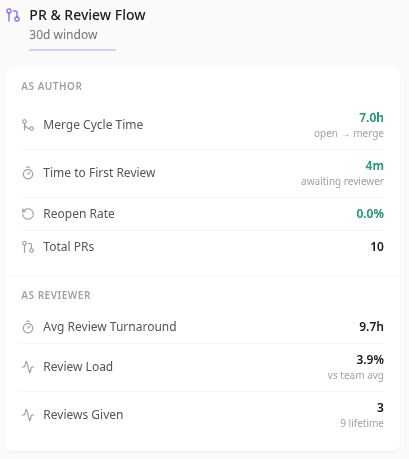
Quick metrics surface the numbers that matter for coaching and calibration — commit volume, PR count, review participation, and consistency — without requiring a data export.
People risk
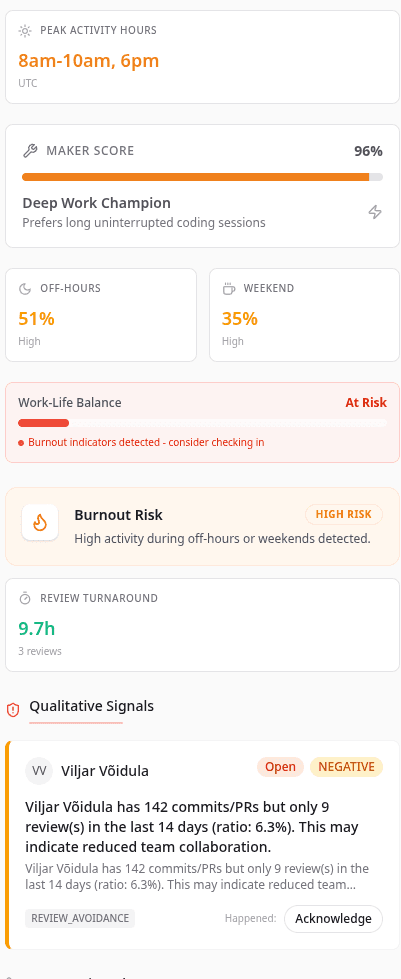
Off-hours coding, weekend commits, and review avoidance are leading indicators. Forgemaster surfaces them automatically — no survey, no 360, no HR request.
The cost of not catching burnout early is usually an exit — not a warning.
Calibration context
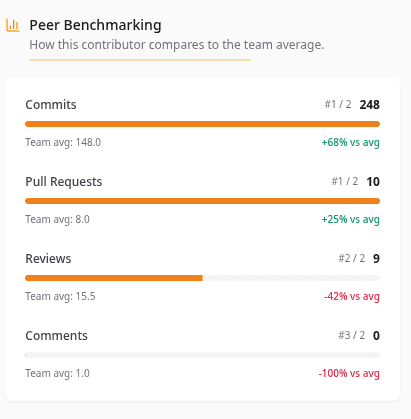
Peer benchmarking shows how a contributor compares to the team across commits, pull requests, reviews, and comments — with rank and percentage differential for each.
Career decisions
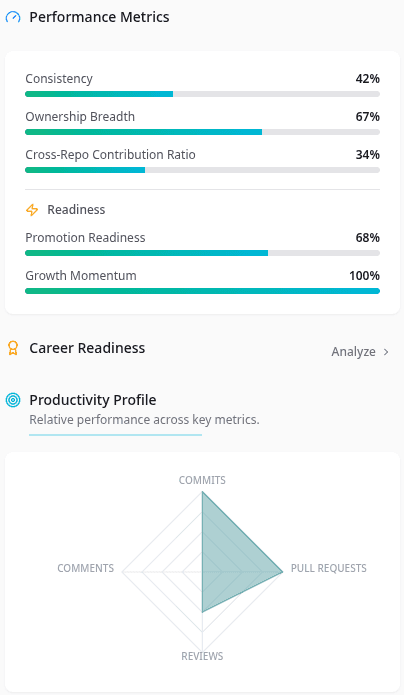
Performance metrics break down consistency, ownership breadth, cross-repo ratio, and growth momentum — each derived from actual work, not self-assessment.
Ownership risk
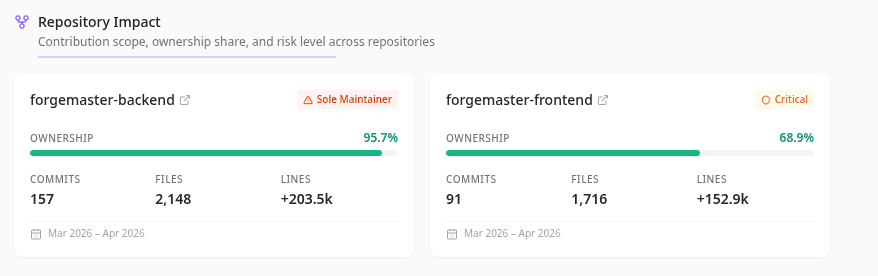
Repository impact shows ownership share, commit concentration, and file breadth per repo. A contributor with 95.7% ownership of a production system is a key-person risk — not just a star performer story.
Compensation, promotion, and retention decisions should start here for contributors with critical system ownership.
Technical depth
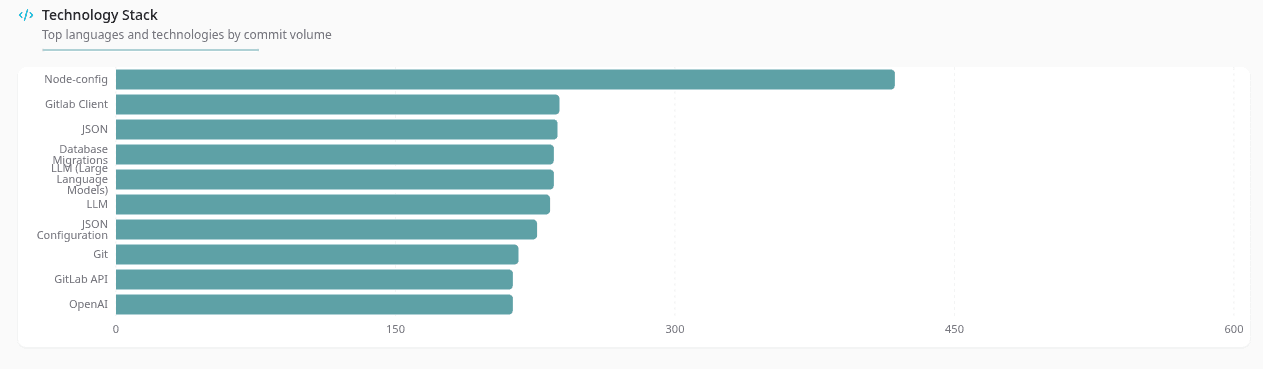
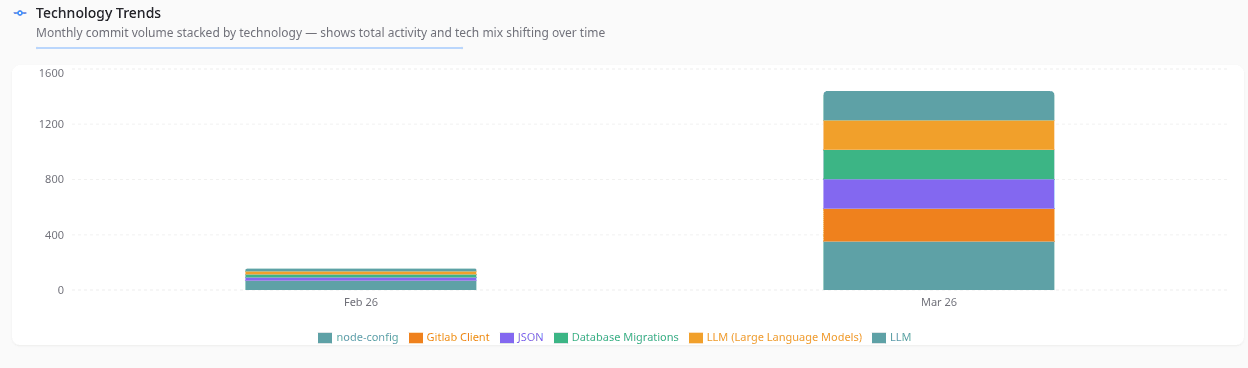
Technology stack shows commit volume by language and tooling. Technology trends show how the mix shifts month over month. Together they give a hiring-grade view of a contributor's real expertise.
Compensation intelligence
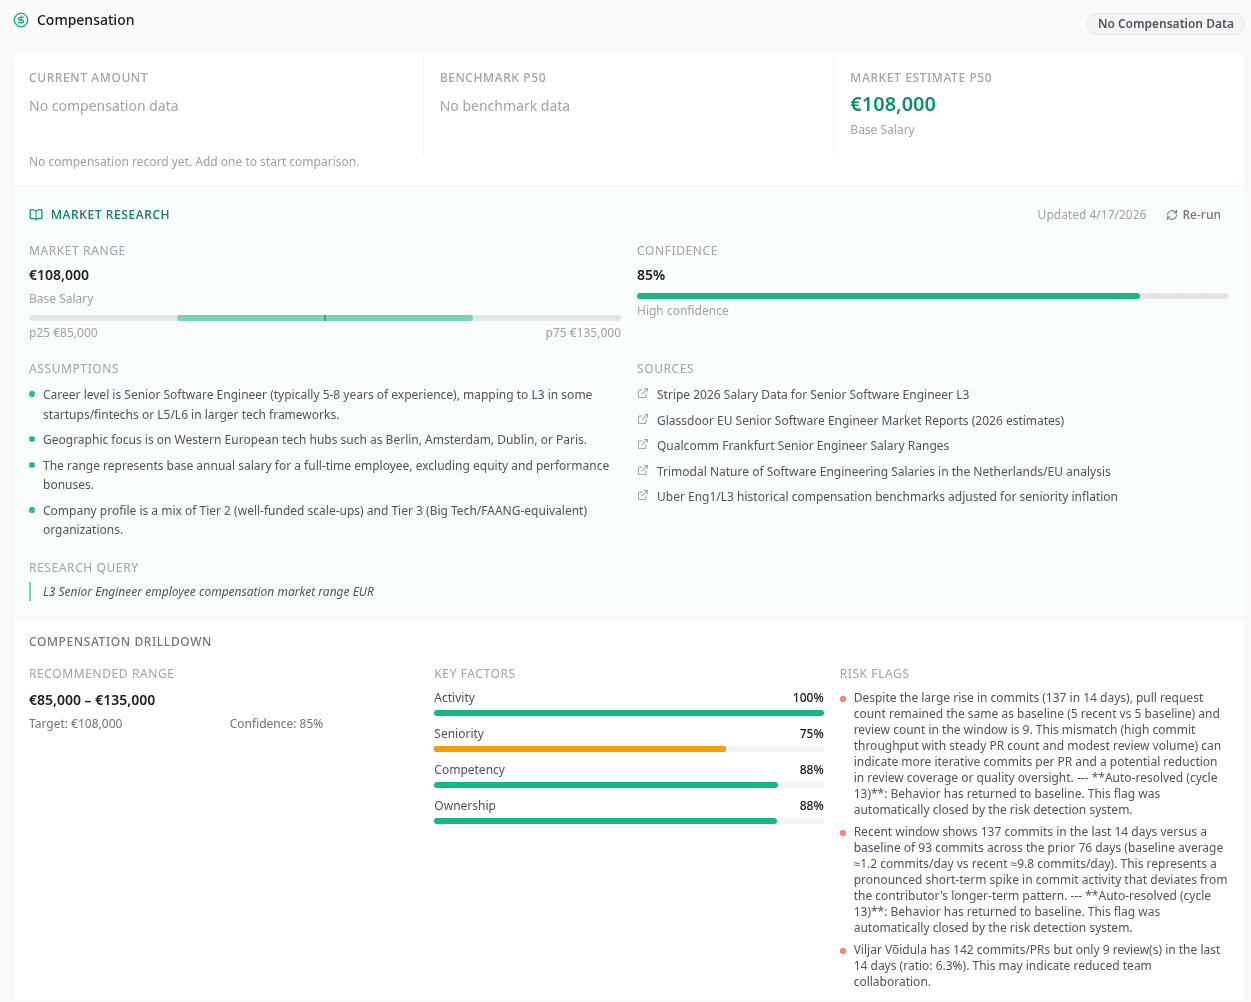
The compensation view connects market estimate, confidence score, and risk flags in one place. CTOs and founders can see whether a contributor is under-market before a retention conversation becomes a resignation conversation.
No more comp decisions based on what you paid last year or a half-remembered survey.
Manager workflow
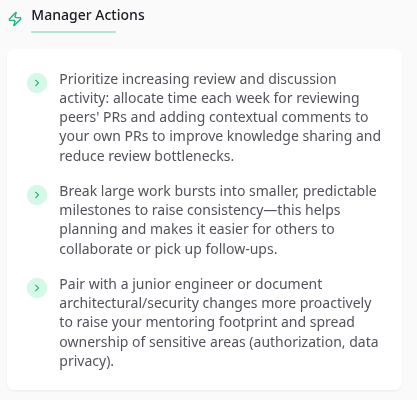
Manager actions translate contributor patterns into concrete coaching recommendations — not vague performance notes. Each action item is backed by the data that surfaced it.
How teams use it
The most useful way to use contributor profiles is inside recurring manager work — not as a separate performance tool.
Open the profile after the weekly review or before a 1:1 to see pattern shift at the individual level.
The situation is grounded in current evidence, not memory.
Use work pattern, ownership share, and health cues together before deciding what the signal actually means.
The manager has a sharper read before the conversation starts.
Use the profile to anchor 1:1 prep, knowledge transfer planning, compensation calibration, or a retention decision.
Contributor context converts into real leadership action.
How we build it
Every signal comes from version control and code review activity — not self-assessment, surveys, or subjective input.
Numbers reflect actual contribution patterns. We do not gamify scores to make dashboards look impressive.
Data is scoped to what you connect. We do not crawl public profiles, cross-reference external sources, or retain contributor data beyond your authorized setup.
What changes
That tends to improve both the quality of support and the quality of decisions.
Manager prep starts from actual work context instead of vague intuition or stale notes.
< 5 min to full contributor context vs. 20–30 min hunting notes
Leadership can see when a high-impact person is carrying unhealthy strain or too much fragile ownership.
4–6 weeks earlier signal than waiting for the exit interview
Career conversations reflect demonstrated depth and operating pattern, not just tenure or recency bias.
3× more context per conversation vs. relying on memory alone
See it in action
Browse the team, open one profile, and walk into the 1:1 with the context already loaded from real data — not gut feel.
Name
Commits
PRs
Signal
Alex Chen
Sr. Engineer
61
14
ActivePriya Rajan
Engineer II
38
9
ActiveMarcus Webb
Lead Engineer
12
3
LowSarah Kim
Engineer III
47
12
At riskGo deeper
They help you move from one person's context into team, repo, or manager workflow follow-through.
Use it in manager work
Check the wider system
Repo clarity
When delivery drag keeps repeating, compare repo health, ownership concentration, and technical friction to find the cause.
Ownership continuity
When critical systems depend on too few people, use repo ownership and depth data to strengthen coverage early.
Start from the contributor profile, then carry the signal into team health, repo impact, or the manager workflow. We can show you how it all connects in a 30-minute walkthrough.